
Total Cost of Ownership: The Framework Frugal Shoppers Actually Use

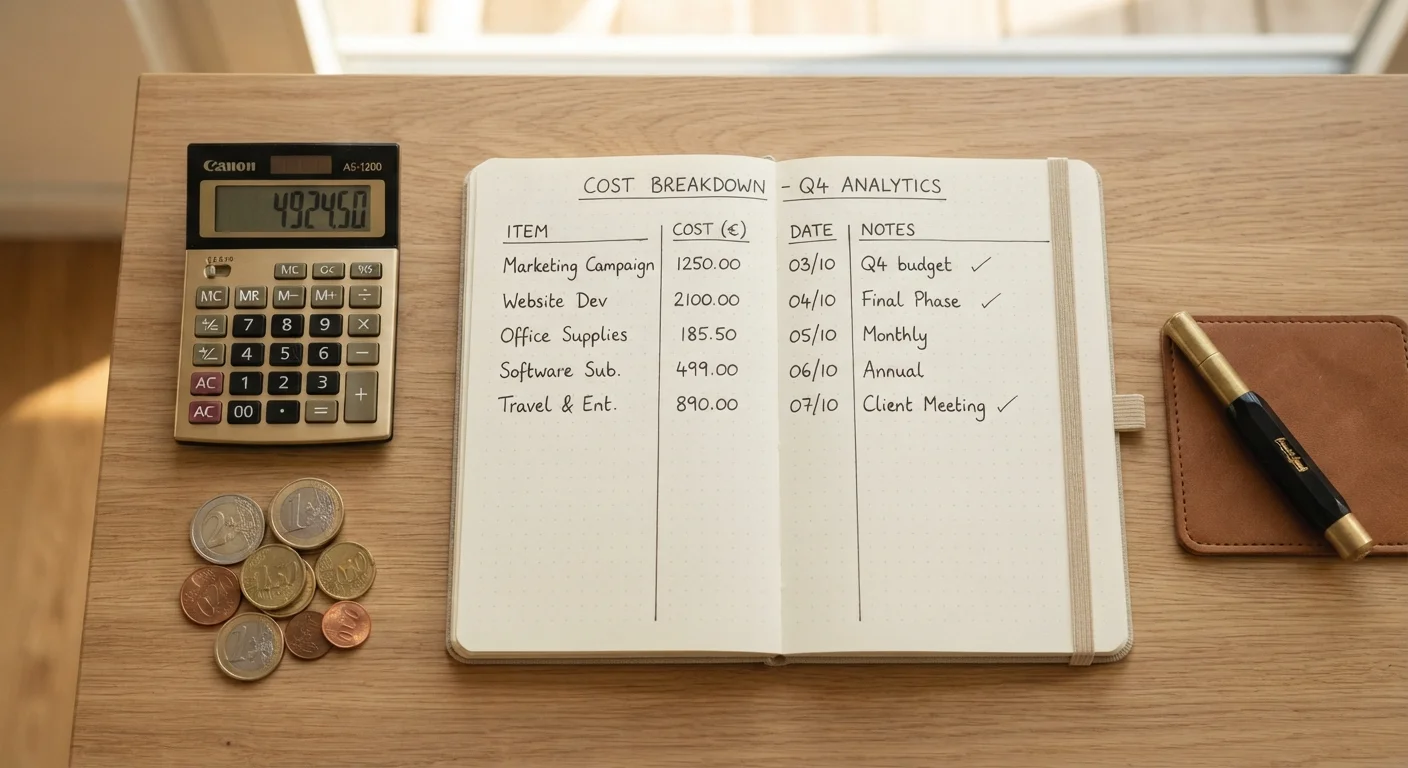
Photo: InsightsChief.com | Your Source Of Trusted Insights editorial
Key Takeaways
- Purchase price typically represents a fraction of what a product costs over its usable life.
- A simple five-category framework captures most hidden ownership costs before you commit.
- Comparing two products on sticker price alone frequently leads to the more expensive long-term choice.
- Estimating ownership period upfront changes which cost categories matter most.
- Even rough TCO estimates reveal trade-offs that point-of-sale pricing deliberately obscures.
Why Sticker Price Is a Poor Proxy for Cost
Purchase price is the most visible number in any buying decision, which is exactly why it gets disproportionate weight. Retailers and manufacturers know this - shelf placement, promotional signage, and comparison advertising are all built around the acquisition moment. But for most durable goods, the sticker price represents a minority of what you will actually spend.
Consider a household appliance with a modest purchase price but high energy consumption and expensive proprietary filters. Over five years, operating and consumable costs can easily exceed the original price. The same dynamic appears in electronics, vehicles, and power tools. Understanding how retail pricing tactics shape perception helps explain why point-of-sale comparisons so reliably mislead buyers.
Total cost of ownership (TCO) - a framework borrowed from business procurement - corrects for this by capturing every cost associated with owning and operating a product across its usable life. It is general financial information, not a guarantee of specific savings, but it consistently produces better-informed decisions than sticker price alone.
Build a Simple Comparison Spreadsheet
What You Need Before You Start
Effective TCO analysis does not require precision - it requires completeness. Rough estimates across all cost categories outperform exact figures in just one or two. Before working through the steps below, gather what you have available.
What you will need
Spreadsheet application
Organize cost categories by product option and calculate running totals across the ownership period.
Manufacturer or retailer documentation
Source maintenance schedules, energy ratings, warranty terms, and consumable replacement intervals.
Independent reliability and repair data
Supplement manufacturer claims with real-world maintenance frequency and cost estimates from consumer research sources.
If you are evaluating a product category you have little experience with, these transferable evaluation principles can help you identify which specifications and cost drivers actually matter in that category.
TCO Is Educational, Not Prescriptive
The Six-Step TCO Process
Work through each step in order. The process is designed to be completed in one sitting for most consumer purchases, with more time needed for complex or high-value items like vehicles or major appliances.
Define your ownership horizon
Before calculating any costs, decide how long you realistically expect to own the product. This single number - your ownership horizon - determines which cost categories dominate the equation. A two-year ownership period makes upfront price and resale value the most important variables. A ten-year horizon shifts weight toward maintenance, energy, and consumables.
Be honest about past behavior. If you typically upgrade electronics every three years, use three years, not ten. If you plan to drive a vehicle until it stops running, use a longer window. Overestimating your ownership period inflates long-term cost projections and can make durable options look worse than they are.
Record the acquisition cost in full
Write down everything you will pay to take ownership, not just the sticker price. Acquisition cost includes sales tax, delivery or installation fees, required accessories, and any financing charges if you are not paying cash. For financed purchases, use the total repayment amount - principal plus interest - not the monthly payment.
Retailers and manufacturers frequently advertise monthly payments rather than total costs because smaller numbers feel manageable. Comparing two products on monthly payment alone, especially across different loan terms, is one of the most common and costly comparison errors consumers make. The tactics that make prices feel smaller are worth understanding before you reach this step.
Estimate ongoing operating costs
Operating costs are the recurring expenses tied to using the product over your ownership horizon. The most common categories are:
- Energy or fuel consumption - use the product's rated consumption figure, convert it to your local rate, and multiply by estimated annual usage hours or miles.
- Consumables - ink cartridges, filters, blades, batteries, or any item that depletes with use and must be periodically replaced.
- Subscription or service fees - cloud storage, extended warranties, software licenses, or platform access tied to the product.
Multiply each annual figure by your ownership horizon to get a lifetime operating cost. For vehicles, this framework applies directly - the full range of vehicle operating costs illustrates how quickly fuel and consumables accumulate over time.
Factor in maintenance and repair
Scheduled maintenance keeps a product functioning as intended; unscheduled repairs address failures. Both belong in your estimate. For scheduled maintenance, the manufacturer's service manual or product documentation typically outlines intervals and associated tasks. For repair frequency, independent consumer research and product forums often provide more realistic data than manufacturer literature.
Assign a conservative annual maintenance budget based on product category norms, then multiply by your ownership horizon. Add a one-time contingency - typically one or two major repair events - based on the product's expected failure rate in that category. Skipping this step is one of the most reliable ways to underestimate true ownership cost, a pattern that plays out repeatedly with both consumer electronics and vehicles. The common ownership cost assumptions that backfire illustrates how these gaps compound over time.
Estimate end-of-life value or disposal cost
Some products retain resale value; others carry disposal costs. At the end of your ownership horizon, subtract expected resale or trade-in value from your running total, or add any disposal fees if applicable (electronics recycling, appliance haul-away, or vehicle decommissioning costs). Resale value is inherently uncertain - treat it as a rough offset, not a guaranteed return.
For products with volatile secondary markets, a conservative approach is to assign zero resale value and treat any proceeds as a windfall. This avoids the trap of justifying a higher upfront cost on the assumption of strong resale that may not materialize.
Sum and compare across options
Add acquisition cost, lifetime operating cost, lifetime maintenance estimate, and disposal costs, then subtract expected resale value. The result is your estimated total cost of ownership for that product over your defined horizon.
Repeat this for each option you are evaluating. Divide each total by your ownership horizon in years to produce an annual cost figure - this normalizes comparisons when two products have different expected lifespans. A product that costs more upfront but lasts significantly longer and costs less to operate can carry a lower annual cost than a cheaper alternative.
This is the framework that separates value from price. For a broader grounding in purchase decision principles, the complete consumer decision guide covers how TCO fits into the full evaluation process.
Beware of Incomplete Cost Estimates
For vehicle purchases specifically, TCO analysis takes on additional complexity. The long-term cost comparison of leasing versus buying applies this same ownership-horizon logic to one of the most consequential consumer decisions households make. The full ownership costs hub provides additional category-specific breakdowns.
Putting the Numbers to Work
A completed TCO estimate gives you two things: a more accurate picture of what each option actually costs, and a structured way to discuss trade-offs. A higher-priced product that produces a lower annual TCO figure is not automatically the right choice - budget constraints, uncertainty in your estimates, and personal priorities all matter. But you are now working from a more complete set of facts.
Use the annual cost figure as your primary comparison metric when products have different expected lifespans. Use the total cost figure when comparing products you expect to own for the same period. Either way, you have moved the decision beyond sticker price, which is the core value of the framework.
For a structured approach to the broader purchase decision - including how to define what you need before evaluating any options - the complete consumer decision guide is a natural next step. If you want to sharpen your ability to interpret product specifications during research, reading specs without getting lost in the jargon covers which numbers actually predict real-world performance. For household budget context, the budgeting basics hub provides a practical grounding for fitting these costs into your overall financial picture.
This article is for general informational and educational purposes only. It does not constitute personalized financial, legal, or purchasing advice. Consult a qualified financial professional before making significant purchasing decisions that affect your household finances.
The content provided on our blog site traverses numerous categories, offering readers valuable and practical information. Readers can use the editorial team’s research and data to gain more insights into their topics of interest. However, they are requested not to treat the articles as conclusive. The website team cannot be held responsible for differences in data or inaccuracies found across other platforms. Please also note that the site might also miss out on various schemes and offers available that the readers may find more beneficial than the ones we cover.