
Flat-Rate vs. Category Cashback Cards: A Side-by-Side Breakdown

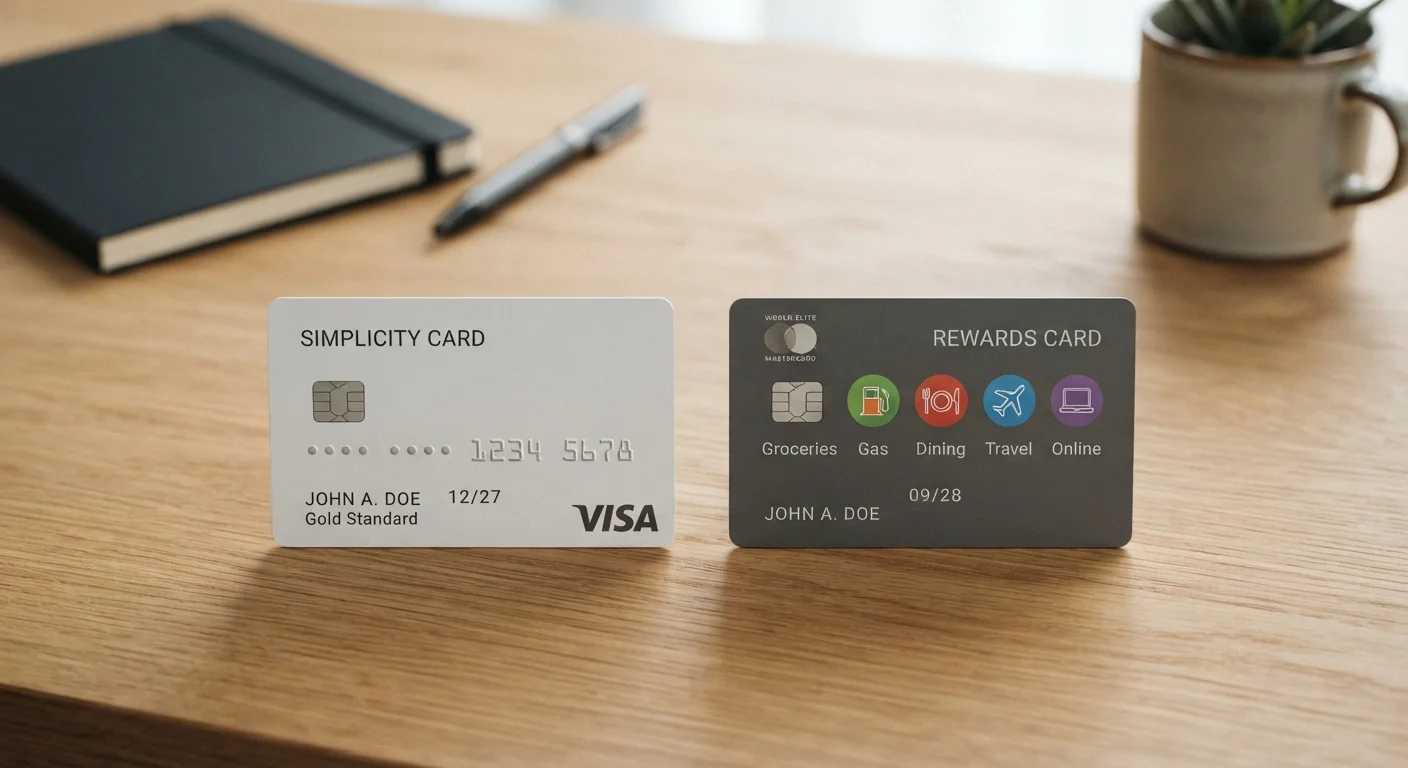
Photo: InsightsChief.com | Your Source Of Trusted Insights editorial
Key Takeaways
- Flat-rate cards offer a uniform cashback percentage on all purchases, typically between 1.5% and 2%.
- Category cards pay elevated rates (often 3%-6%) in select spending areas but lower rates everywhere else.
- Your actual return depends on how closely your spending aligns with whichever card's structure you choose.
- Annual fees, spending caps, and rotating categories can significantly affect real-world value on category cards.
- Carrying a balance on either card type erases reward value; interest charges almost always exceed cashback earned.
How Each Card Structure Works
Flat-rate cashback cards apply a single, fixed percentage - commonly 1.5% or 2% - to every eligible purchase, regardless of merchant type. Swipe at a hardware store, a restaurant, or an online retailer and the math is identical. This simplicity is the product's core appeal.
Category cashback cards take a tiered approach. They pay a higher rate - often 3% to 6% - within defined spending categories such as groceries, gas stations, streaming services, or dining. Purchases outside those categories typically earn a base rate of 1% to 1.5%, similar to a flat-rate card's floor. Some cards use fixed, permanent categories while others rotate quarterly, sometimes requiring the cardholder to manually activate the bonus each period.
Understanding the mechanics matters before doing any math. For a deeper look at how cashback fits into the broader rewards landscape, see how cashback compares to points and miles.
| Criterion | Flat-Rate Cards | Category Cards |
|---|---|---|
| Cashback on all purchases | 1.5%-2% uniformly | 1%-1.5% base rate |
| Cashback in bonus categories | Same flat rate applies | 3%-6% in select areas |
| Category tracking required | None | Yes, often with activation |
| Spending caps | Typically none | Common on elevated tiers |
| Complexity | Very low | Moderate to high |
| Annual fee likelihood | Often no annual fee | Varies; some carry fees |
| Best scenario | Varied, spread-out spending | Concentrated category spend |
When Flat-Rate Cards Come Out Ahead
A flat-rate card earns more than a category card whenever your actual out-of-category spending is substantial. Suppose you spend $3,000 per month but only $600 of that falls in a card's elevated categories. At a 2% flat rate you earn $60. A category card paying 5% on $600 and 1% on $2,400 returns $30 + $24 = $54 - less than the simpler option.
Flat-rate cards also win on predictability. There are no spending caps that cut the elevated rate mid-month, no quarterly activations to forget, and no category definitions that unexpectedly exclude a merchant. For households with genuinely varied spending - home improvement, childcare, travel supplies, miscellaneous online orders - the consistent rate often outperforms tiered alternatives in practice, even if category rates look impressive on paper.
~$1,000
Average US monthly household grocery spend
According to the U.S. Bureau of Labor Statistics Consumer Expenditure Survey, food-at-home expenses represent one of the largest recurring household budget categories.
3%-6%
Typical bonus rate on category cards
Category cashback cards commonly advertise elevated rates in grocery, gas, and dining tiers, though spending caps and eligibility criteria vary by issuer.
20%+
Average credit card APR in the US
Federal Reserve data consistently shows average credit card interest rates above 20%, meaning an unpaid balance quickly negates any cashback earned.
When Category Cards Pull Ahead
Category cards outperform when a large, consistent portion of monthly spending falls squarely within their elevated tiers. Groceries are the most common example. A household spending $800 per month on groceries and earning 5% cashback on that category alone generates $40 from groceries - before counting anything else. A 2% flat-rate card on the same $800 earns only $16 from that single category.
The gap widens further for households that stack category card rewards with store loyalty programs or cashback apps. Grocery shopping and cashback strategies explores how these layers interact at the checkout. Category cards also tend to reward dining and gas heavily - two categories where budget-conscious households frequently have concentrated spend.
The key caveat: spending caps. Many category cards limit the elevated rate to a set annual or quarterly spending amount, then revert to the base rate. Verify those caps against your actual spending before concluding a category card will outperform.
Hidden Factors That Shift the Math
Annual fees can meaningfully change the comparison. A category card charging a $95 annual fee must generate at least $95 more in rewards than a no-fee flat-rate alternative just to break even. Run that calculation against your realistic spending before applying.
Rotating-category cards add another variable: activation. Cards that require quarterly enrollment to unlock bonus rates mean cardholders who forget the deadline earn only the base rate for that period - often for three full months. That gap can eliminate the theoretical advantage entirely.
The most important factor of all is balance carrying. Interest charges on rewards cards erode cashback value rapidly. A card earning 5% cashback on groceries while accruing 24% APR interest on an unpaid balance is a net financial loss. Both card types are general-purpose tools for information purposes - consult a licensed financial adviser before making decisions based on your individual circumstances.
You can also compare how credit card cashback stacks against app-based rebates by reviewing how cashback apps and coupon codes differ.
This Is General Information, Not Financial Advice
The content provided on our blog site traverses numerous categories, offering readers valuable and practical information. Readers can use the editorial team’s research and data to gain more insights into their topics of interest. However, they are requested not to treat the articles as conclusive. The website team cannot be held responsible for differences in data or inaccuracies found across other platforms. Please also note that the site might also miss out on various schemes and offers available that the readers may find more beneficial than the ones we cover.