
The Complete Guide to Total Cost of Vehicle Ownership in the US

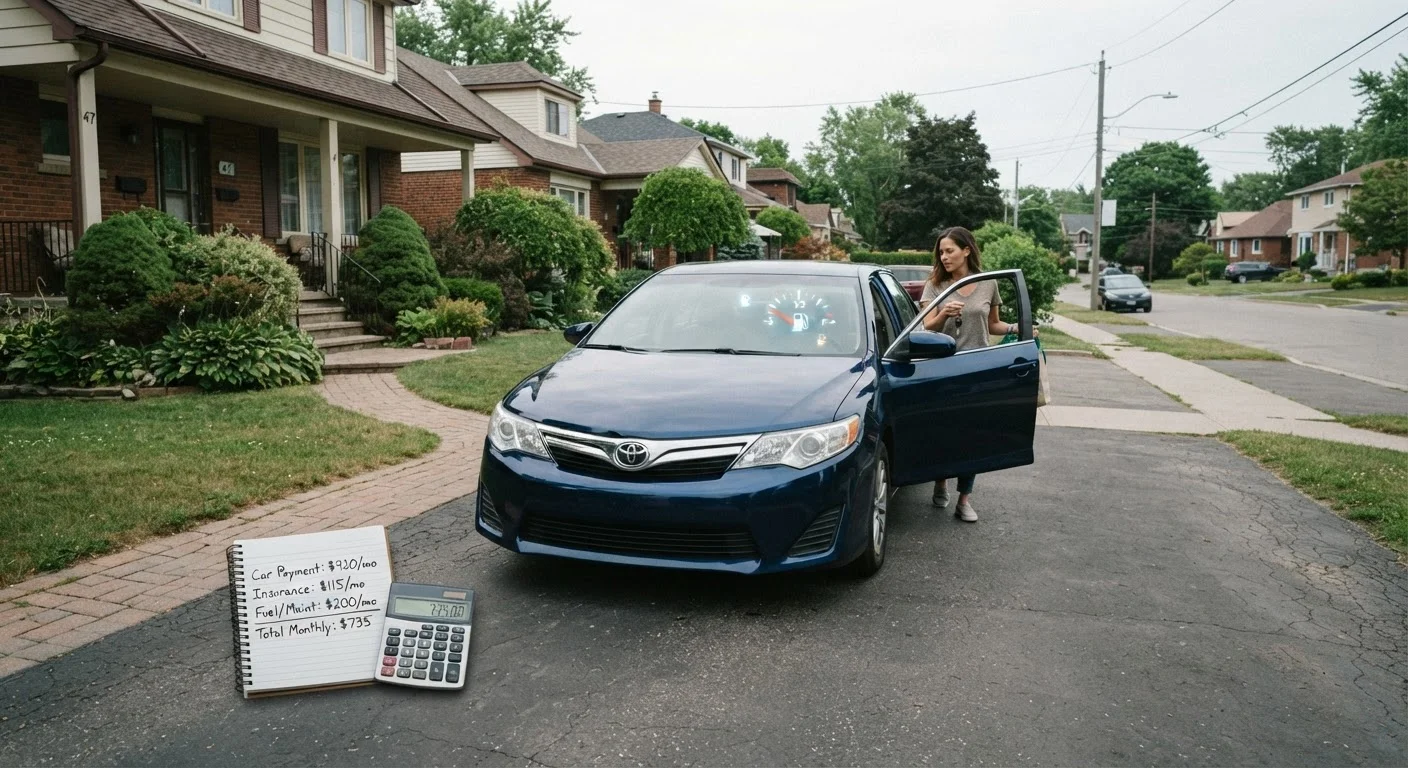
Photo: InsightsChief.com | Your Source Of Trusted Insights editorial
Key Takeaways
- The sticker price represents only a fraction of what you will spend on a vehicle over its lifetime.
- Depreciation is typically the single largest cost of car ownership, often exceeding fuel and insurance combined.
- Financing terms significantly affect total cost - a lower monthly payment can mean paying thousands more overall.
- Routine maintenance is the most controllable cost category and has a direct impact on resale value.
- Choosing a vehicle with lower insurance rates and better fuel economy compounds savings over years of ownership.
- A consistent cost-tracking habit helps drivers make better decisions at every stage of ownership.
What Total Cost of Ownership Actually Means
Total cost of ownership (TCO) is the full financial picture of owning a vehicle - every dollar spent from the moment you sign the purchase papers to the day you sell or trade in the car. It encompasses the purchase price, financing charges, taxes and fees, fuel, insurance premiums, scheduled maintenance, unexpected repairs, registration, and the loss in value the vehicle experiences over time.
Most drivers focus narrowly on the monthly payment when evaluating affordability. TCO reframes the question: not "Can I afford this payment?" but "What will this vehicle cost me over five years?" That shift in perspective can mean the difference between a manageable transportation budget and one that quietly drains household finances.
For a practical introduction to each cost category, see our category-by-category driver's reference. If you are new to car ownership entirely, this starting-point guide for new drivers covers the essentials in plain language.
~$12,000
Average annual cost to own and operate a vehicle
AAA's annual "Your Driving Costs" study consistently estimates total ownership costs for the average new vehicle in the range of $10,000-$12,000+ per year when all categories are included.
15-20%
New vehicle value lost in year one
Industry data and automotive research organizations broadly estimate that new vehicles depreciate by 15-20% in their first year of ownership.
~50%
Value lost within five years for many new vehicles
Automotive valuation data commonly shows that the average new vehicle retains roughly half its original value after five years, with significant variation by segment.
The Purchase Decision: Price vs. True Cost
The negotiated sale price is the most visible number in any vehicle transaction, but it is not the most consequential one over time. Two vehicles with identical sticker prices can have dramatically different five-year TCOs depending on their insurance rating, fuel economy, parts availability, and typical repair frequency.
Before committing to a purchase, consider estimating the following for each vehicle you are comparing:
- Average insurance premium for your driver profile and location
- Fuel cost based on the vehicle's EPA-rated MPG and your estimated annual mileage
- Scheduled maintenance intervals and costs (some manufacturers require premium fuel or specialized service)
- Projected depreciation over your intended ownership period
- State sales tax, registration fees, and any local levies
This kind of pre-purchase analysis is also the backbone of the TCO framework that frugal shoppers use before committing to any major purchase.
Run a cost-per-mile estimate for each vehicle you are seriously considering, not just the monthly payment. Divide your five-year TCO estimate by your expected total miles to create a genuinely apples-to-apples comparison.
Ask for the dealer's documentation fee, registration estimate, and any add-on charges before you negotiate the vehicle price. These fees can add $1,000-$2,500 to the transaction and are often presented only at signing.
Financing, Depreciation, and Opportunity Cost
Depreciation - the loss in a vehicle's market value over time - is consistently the largest single cost of car ownership for most drivers. A new vehicle can lose 15-20% of its value in the first year alone, and roughly 50% within five years, though this varies by make, model, market conditions, and mileage.
Financing amplifies the total cost. At higher interest rates, the total interest paid over a 60- or 72-month loan can add several thousand dollars to the cost of even a moderately priced vehicle. Extending the loan term reduces the monthly payment but increases total interest paid and can leave a borrower "underwater" - owing more than the vehicle is worth - for the first several years.
For general educational context on auto loan structures and what to watch for, our car insurance hub covers how financing decisions interact with coverage requirements.
This content is general financial information for educational purposes only and is not personalized financial or lending advice. Consult a licensed financial professional for guidance specific to your situation.
Running Costs: Fuel, Insurance, and Maintenance
Once you own a vehicle, three categories dominate ongoing spending: fuel, insurance, and maintenance. Together, these can account for $4,000-$9,000 or more annually depending on vehicle type, location, driving habits, and coverage choices - figures consistent with data reported by organizations that track household transportation costs.
Fuel
Fuel costs scale directly with miles driven and inversely with fuel economy. A vehicle rated at 25 MPG driven 15,000 miles annually consumes 600 gallons of fuel per year. At $3.50 per gallon, that is $2,100. A vehicle rated at 35 MPG under the same conditions uses 429 gallons - roughly $660 less per year, compounding to over $3,000 across five years.
Insurance
Auto insurance premiums vary widely based on driver history, location, vehicle type, and chosen coverage levels. Understanding your auto insurance options is essential because over-insuring an older, low-value vehicle or under-insuring a newer one both carry real financial risk. Review your coverage annually.
Maintenance
Routine maintenance - oil changes, tire rotations, brake inspections, filter replacements - is the most controllable cost in the TCO equation. Skipping or delaying scheduled service rarely saves money in the long run; deferred maintenance is a leading cause of costly repairs. Our car maintenance hub provides guidance on keeping vehicles running reliably within a realistic budget.
Reducing Your Total Cost Without Sacrificing Reliability
Reducing TCO is not about cutting corners - it is about making deliberate choices at each stage of ownership. Several strategies have a meaningful, evidence-supported impact:
- Follow the manufacturer's maintenance schedule. Consistent upkeep prevents expensive component failures and preserves resale value.
- Shop insurance annually. Premiums are not static; your risk profile changes, and so does the market. Shopping at renewal can surface meaningfully different rates.
- Minimize unnecessary mileage. Every mile adds depreciation, fuel cost, and wear. Combining errands and using alternatives where practical reduces all three simultaneously.
- Pay attention to tire pressure and driving habits. Properly inflated tires and smooth driving improve fuel economy and extend tire life - two of the easier wins available to any driver.
- Hold vehicles longer when practical. The depreciation curve flattens significantly after the first few years. Owners who hold a well-maintained vehicle for eight to ten years instead of trading every three to four often see substantially lower average annual costs.
For a year-round approach to managing these costs, our year-round cost management guide offers concrete planning strategies.
Putting It All Together: A Practical Framework
A useful TCO estimate does not require sophisticated software. A simple spreadsheet covering the following categories over your expected ownership period provides a working picture:
- Acquisition cost: Purchase price plus taxes, fees, and any dealer charges
- Financing cost: Total interest paid over the loan term
- Depreciation estimate: Difference between purchase price and projected resale or trade-in value
- Fuel: Annual gallons × price per gallon × years owned
- Insurance: Annual premium × years owned
- Maintenance and repairs: Scheduled service plus a reserve for unexpected repairs (a common rule of thumb is setting aside 1-2% of the vehicle's current value annually, though this varies)
- Registration and taxes: Annual fees × years owned
Divide the total by the number of months (or miles) to get a per-unit cost that makes different vehicles genuinely comparable. This number is more useful than any sticker price for evaluating what you can actually afford.
For a fuller breakdown of what American drivers typically spend across all these categories, our annual cost breakdown article provides detailed, data-grounded figures you can use as benchmarks.
Informed ownership starts with understanding the full cost picture before - not after - you commit to a vehicle. That awareness, applied consistently, is the most reliable path to keeping transportation costs manageable over the long term.
The content provided on our blog site traverses numerous categories, offering readers valuable and practical information. Readers can use the editorial team’s research and data to gain more insights into their topics of interest. However, they are requested not to treat the articles as conclusive. The website team cannot be held responsible for differences in data or inaccuracies found across other platforms. Please also note that the site might also miss out on various schemes and offers available that the readers may find more beneficial than the ones we cover.